


NOT AN AGENCY – SPECIALISTS
We are a team of UX specialists. We help companies understand their users through data, research and eye tracking.
PROJECT WITH:




[ THREE QUESTIONS, THREE MEASUREMENTS ]
What users see, how they react
and what overloads them.
Analytics shows WHERE people clicked. A survey shows WHAT they think. We measure the third layer: what they actually saw, how strongly they reacted and where the interface mentally overloaded them.
01
Do they even see it?
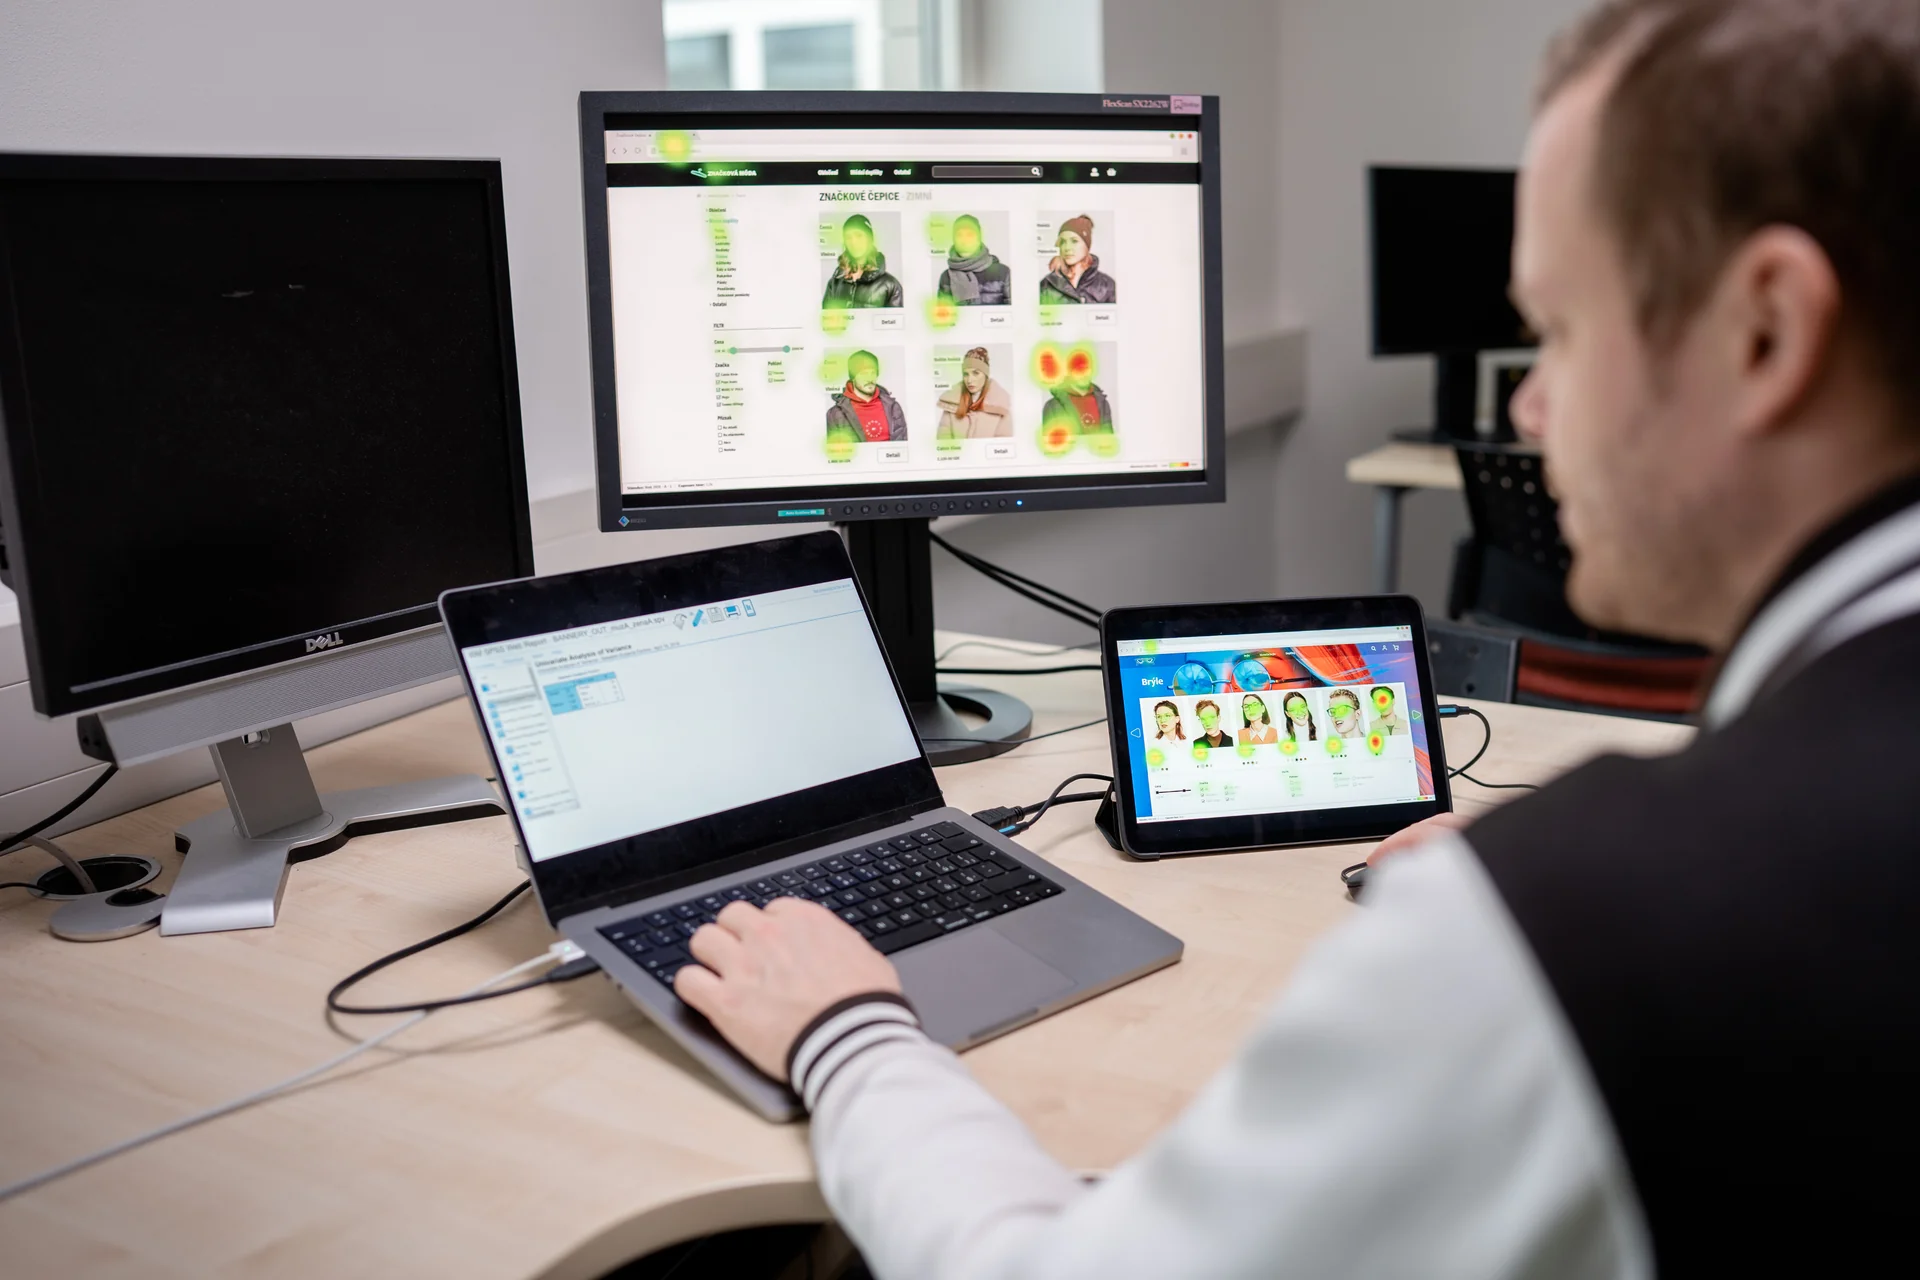
Visual attention — heatmaps, fixations, TTFF, dwell time, AOI analysis and scanpaths. Eye tracking objectively captures what the user actually saw and what they missed.
EYE-TRACKING
02
How strongly do they react?
Physiological arousal and facial signals in the context of the task. We always interpret them with limits — no "emotion reading".
GSR + FACIAL SIGNALS
03
Can they do it without strain?
Cognitive load as one clear 0–100 score. Find out where the interface overloads users, even when they complete the task in the end.
EMLI MODEL
[ GLOSSARY ]
- TTFF
- time to first fixation
- AOI
- area of interest
- dwell time
- total time spent looking at an area
- scanpath
- the path of the gaze between fixations
- GSR
- galvanic skin response, an indicator of physiological arousal
- EMLI
- mental (cognitive) load index derived from eye-tracking metrics
[ OUR SERVICES ]
What we do.
We help you find where a website, app or communication complicates people's journey. We measure the problem, explain its cause and recommend what to fix first.
01
→UX Audit
We go through your website, e-shop or app with a user’s eyes. We find the places where people get stuck, abandon the order or overlook important information. You get a list of fixes sorted by priority.
02
→User Testing
We give real users concrete tasks and watch whether they can complete them. You will see where they get lost, what they don’t understand and why they leave — together with suggestions on what to change.
03
→Eye Tracking
Using eye tracking we measure where people really look. Heatmaps and gaze recordings reveal what they notice, what they overlook and whether important content leads them the right way.
04
→Field Research
We observe customer behaviour right where decisions are made — in the store, showroom, at an event or with a physical product. Mobile eye-tracking glasses show what people notice in the real environment and what they miss.
05
→UX Research
When you need to understand not only what isn’t working, but also why. We combine interviews, observation, testing and reaction measurement so you can decide based on users’ real needs.
06
→Case Studies
See what real measurements revealed: 40% of applicants couldn’t find their way to open positions and 92% of respondents noticed the main CTA. We show the data and the changes it led to.
[ TEST PACKAGES ]
From a quick check to in-depth research. Choose the scope by what you need to find out.
[ EMLI — EYE-TRACKING MENTAL LOAD INDEX ]
Mental load
as a number.
A heatmap shows where people looked. On its own, though, it can't tell whether the interface was easy for them or needlessly overloaded them while completing the task. EMLI combines eight eye-tracking metrics into a single cognitive load score from 0 to 100. The higher the score, the greater the load. That lets you easily compare two design variants, individual form steps or competitor solutions — on data, not on impressions.
The model emerged from academic research at FIM UHK.
The methodology is documented in detail for independent verification.
5+
Completed studies
450+
Study respondents
8
Metrics in the EMLI model
0–100
Load index scale
[ LAB & TECHNOLOGY ]
Technology isn't enough.
Methodology decides.
We measure in the Cognitive Studies Lab at FIM UHK as well as directly in the field. But modern instruments alone don't guarantee a reliable result. That's why every study starts with a clear question, we validate the scenario in advance and check data quality during measurement. We assess the results in the context of the specific task and state openly what can — and cannot — be inferred from them.
ACADEMIC BACKGROUND
Members of the team publish results in the journals Scientific Reports (Nature Portfolio) and the Journal of Environmental Psychology, and at the ACM ETRA conference. We bring the same rigour to client projects — from measurement design to a clear interpretation of the results.
IN COOPERATION WITH:
[ CASE STUDIES ]
What the
measurements revealed.
40% of applicants couldn’t find their way to open positions. Yet the site “looked clear”.
METHOD: Eye tracking + survey · N = 102
The longer the text, the less attention.
METHOD: Eye tracking, AOI analysis · ~120 participants
A character’s gaze steered visitors’ attention.
METHOD: Eye tracking experiment · N = 104
[ HOW WE COLLABORATE ]
How the
collaboration works.
01
Initial consultation
You tell us what you need to find out or decide. Together we choose who and what makes sense to test.
02
Research design
We recommend suitable methods, the number of participants, the scope and the form of the results. You will know in advance which questions the measurement will answer.
03
Test preparation
We prepare the tasks, materials and questionnaires. For a more complex project we first validate everything with a pilot measurement.
04
Measurement
We test in the lab or directly in the field. We watch over the correct procedure and the quality of the recorded data.
05
Results and recommendations
We connect the data with observation and users’ statements. You get clear conclusions, priorities and recommendations on what to fix.