[ SERVICES / EYE TRACKING ]
MEASURE
ATTENTION.
Find out what people actually see.
Eye tracking records where people look while working with a website, app or visual, in what order and for how long. It reveals elements that attract attention as well as important information that goes unnoticed.
We connect the data with the course of the task and turn it into concrete recommendations for content, layout and visual hierarchy.
DURATION
1–3 weeks
ENVIRONMENT
Lab and field
OUTPUTS
Heatmaps · AOI · gaze plots
PACKAGE
Eye tracking and biometrics
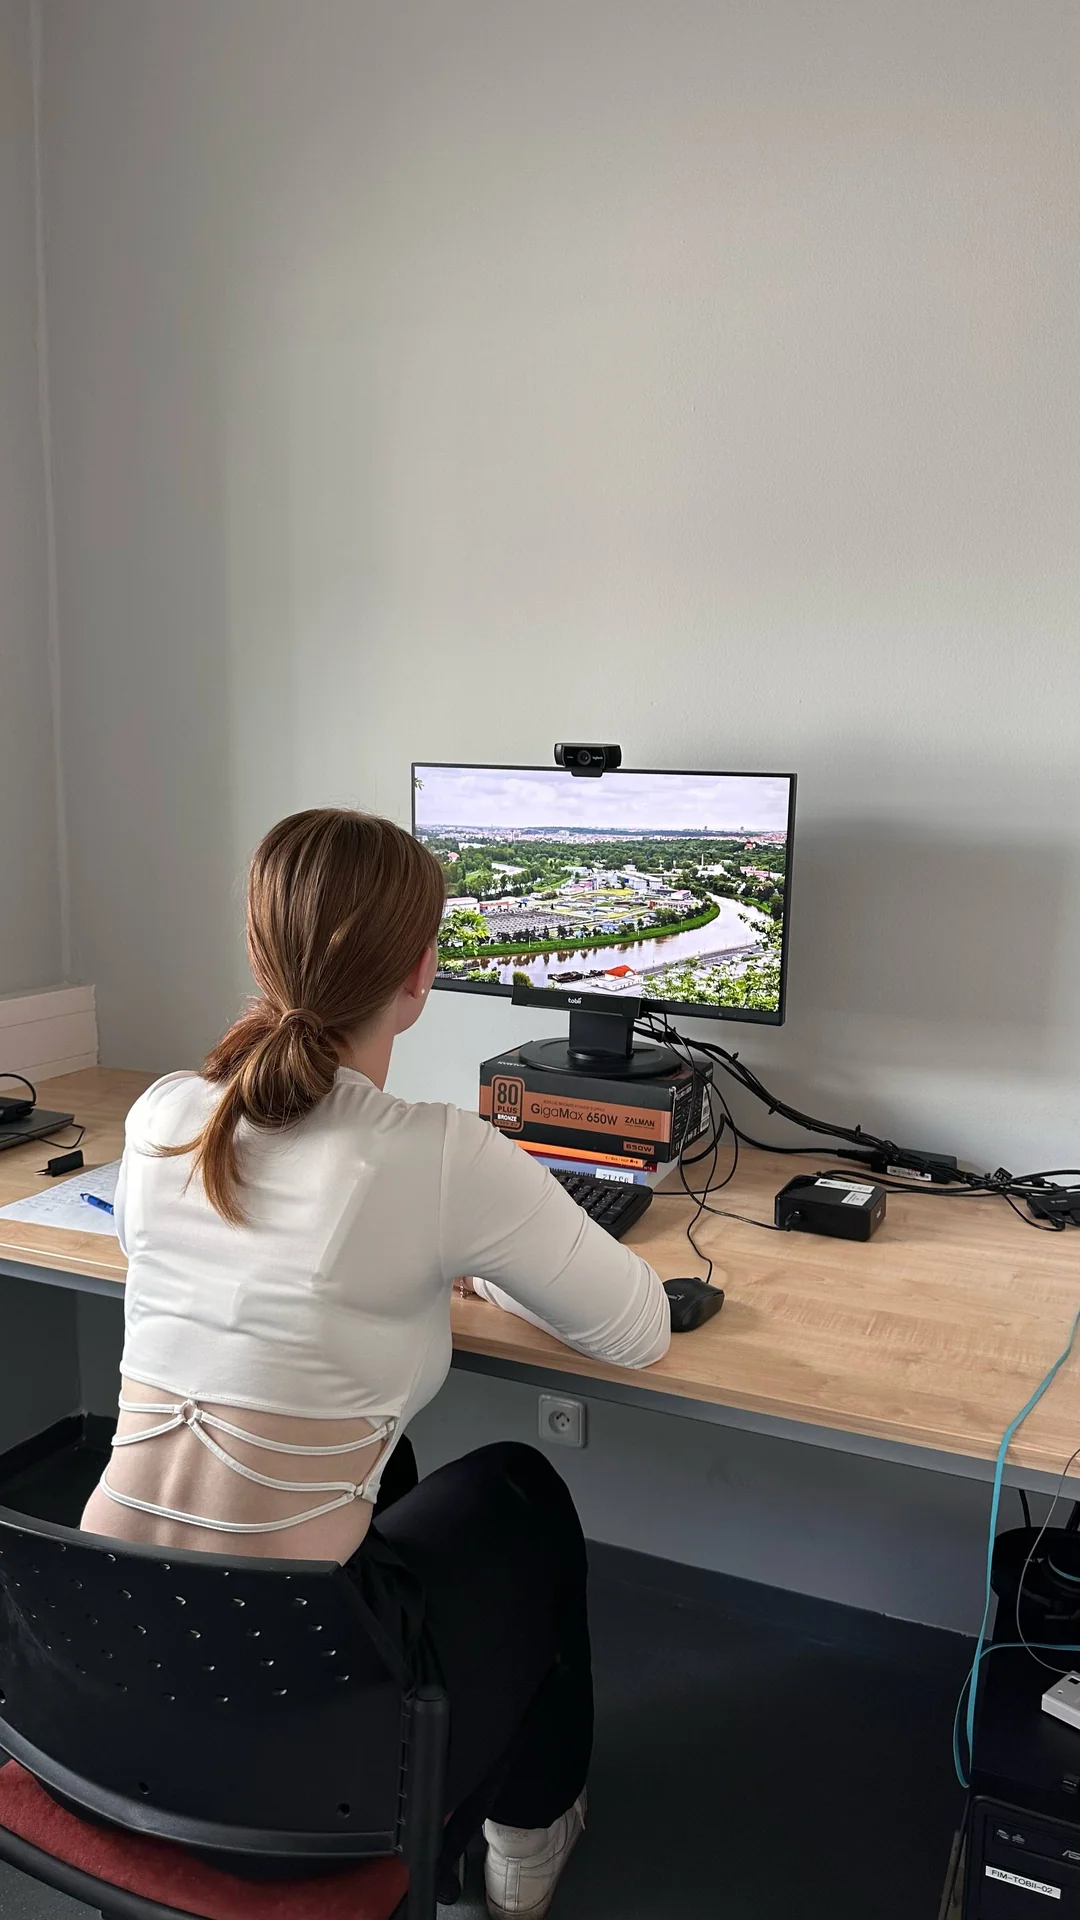
A controlled eye-tracking study in the lab — every recording starts with calibration and follows a prepared scenario.
[ WHAT WE CAN MEASURE ]
Attention is not an impression. It’s a data trail.
What people see first
We measure which element gets the first look and in what order people go through the content.
What goes unnoticed
We reveal important information, offers or controls that the gaze never reaches.
Where people search and go back
Repeated looks and long searching show places where the visual hierarchy doesn’t guide users clearly enough.
Which variant works better
We compare designs by the same metrics and show which variant better directs attention to important content.
[ WHAT YOU GET ]
Not just a heatmap. A basis for decisions.
A picture with colourful spots alone is not enough. We interpret every output according to the task, compare it with participant behaviour and turn it into changes you can use in practice.
Heatmaps and gaze recordings
They clearly show the distribution of attention and the eye path of a specific participant.
Metrics of the tracked areas
For important elements we measure the first fixation, the number of returns and the time attention is given.
Links to the task
We connect the gaze with success, time, errors and participants’ statements.
Priorities and recommendations
We turn the results into concrete changes to content, layout and visual hierarchy.
[ HOW THE MEASUREMENT WORKS ]
From the question to a defensible conclusion.
Research question
We clarify the decision the data should support and choose a suitable scope for the study.
Scenario and piloting
We prepare the tasks and the tracked areas and, before collection, verify that the measurement works correctly.
Data collection
We calibrate and measure in the lab or field according to a consistent protocol.
Analysis and recommendations
We connect the gaze with the task context and turn the results into priorities for practice.
[ TECHNOLOGY ]
Lab and field.
We choose the equipment by the environment and the research question. We use desktop systems for precisely controlled on-screen studies, and mobile glasses to measure attention during real movement and decision-making in a space.
LAB MEASUREMENT
Smart Eye Aurora
A desktop eye tracker for controlled studies of websites, apps and other digital interfaces.
PORTABLE SETUP
Tobii Pro X2-60
A 60 Hz eye tracker for on-screen measurement and comparing variants.
FIELD MEASUREMENT
Mobile eye-tracking glasses (2×)
Two sets for tracking attention in stores, showrooms, at stadiums or on the shop floor.
FIMEYELAB research facilities · Faculty of Informatics and Management, University of Hradec Králové
[ OPTIONAL: THE EMLI MENTAL LOAD INDEX ]
Where the interface demands the most effort.
EMLI converts selected eye-tracking indicators into a score from 0 to 100. It makes it possible to compare individual screens, steps or variants and determine where processing information is more demanding.
The higher the score, the greater the load. We continuously validate EMLI and use it as a complementary interpretive layer, not as standalone proof.
0Lower load
100Higher load
[ EYE TRACKING IN PRACTICE ]
Decisions backed by measurement.
Attention followed the gaze
Where the character on the banner looks, the customer looks too.
EYE TRACKING · N = 104
VIEW STUDY →The photo slowed the decision
The lifestyle photo looked better but lengthened the shopping task.
EYE TRACKING + UEQ · N = 84
VIEW STUDY →A comparison of 16 designs
Instead of a vote, we compared the billboards on 79 people.
EYE TRACKING + SURVEY · N = 79
VIEW STUDY →[ FREQUENTLY ASKED QUESTIONS ]
What is eye tracking and how does it work?
Eye tracking uses a specialised camera to record where a person looks, in what order and for how long. From the eye movement we create a gaze recording and metrics of visual attention.
What can eye tracking find out?
We find out what people notice first, which elements they overlook, where they search and how attention changes between variants. We always evaluate the result in the context of the specific task.
What’s the difference between eye tracking and a heatmap from web analytics?
An analytics heatmap usually works from clicks or cursor movement. Eye tracking records the participant’s actual direction of gaze. Even an eye heatmap alone is not enough, though, so we complement it with other metrics and the course of the task.
How many participants are needed for eye tracking?
The number depends on the goal of the study, the number of target groups and whether we’re looking for qualitative problems or comparing variants. We propose a suitable sample only based on the research question; there is no single universal number.
How long does an eye tracking study take and how much does it cost?
A typical study takes about 1–3 weeks. The price depends on the number of participants, the environment, the scope of stimuli and the required outputs. After an initial brief we prepare a concrete proposal and price.
Does the measurement have to take place in the lab?
No. We most often measure websites, apps and visuals on screen in the lab. For stores, services, events or other real environments we use mobile eye-tracking glasses.
Does eye tracking measure emotions or mental load?
Eye tracking itself measures visual attention, not specific emotions. Depending on the goal of the study we can complement it with biometric methods and with EMLI, our supplementary mental load index derived from selected eye metrics.